|
|
Maps
|
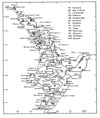
Map 2 Area codes and collecting localities for mainland New Zealand, North Island (from Crosby et al. 1998).
|
|
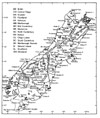
Map 3 Area codes and collecting localities for mainland New Zealand, South Island and Stewart Island (from Crosby et al. 1998).
|
|
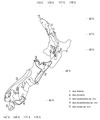
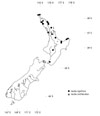
Map 4 Distribution ranges of Aka species, mainland New Zealand.
|
|
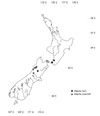
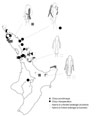
Map 5 Collection localities of Cixius species, mainland New Zealand.
|
|
Map 6 Collection localities of Huttia species, mainland New Zealand.
|
|
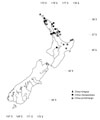
Map 7 Distribution ranges of Koroana species, mainland New Zealand.
|
|
Map 8 Collection localities of Malpha species, mainland New Zealand.
|
|
Map 9 Distribution ranges of Semo species, mainland New Zealand.
|
|
Map 12. Collection localities of Cixius species and hybrid populations.
|
|
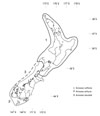
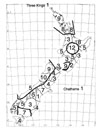
Map 13. Patterns of taxonomic diversity. Numerals indicate numbers of species recorded in selected areas of New Zealand. Thick lines denote regions of greatest species diversity. Areas used are those of Crosby et al. (1998).
|
|
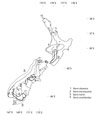
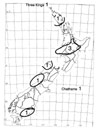
Map 14. Patterns of species endemism. Five regions of endemism were identified on mainland New Zealand, and two regions on off-shore islands. Regions of endemism correspond roughly with the regions of greatest species diversity shown on Map 13.
|
|